Did you know that you can navigate the posts by swiping left and right?
Running the Boston Marathon, with Data! | Sports Analytics
01 Apr 2017
. category:
math
.
Comments
#kaggle
#data
#marathon
Give a “marathon dataset” to a data guy, and he might go ‘meh’. Give it to me, and i’m already pulling out data frames, making ggplots, testing my weird ‘running strategies’! So here it is, another of my rushed attempts at Data Journalism. Have a seat, grab a coffee :)
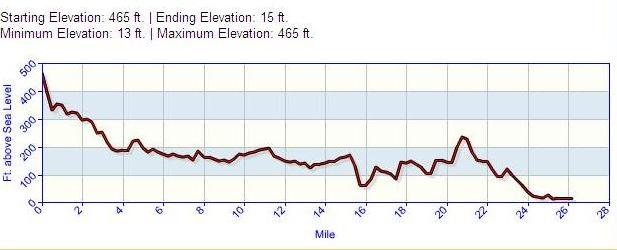
To those unaware, Boston Marathon is one of the most prestigious marathons in the world, having an extremely tough qualifying time. The route spans 42.195km in distance, going over a couple hills around the 32km mark(we’ll talk about this later). Boston’s record timing in the Mens category is 2:03:02, while the World Record stands at 2:02:57. FAST!
Credits to Kaggle Datasets, i got hold of the 2016 marathon dataset, having split timings (every 5km) for all successful athletes. Basically, every athlete’s timing when he crosses 5km, 10km, 15km, 21.0975km(halfway), 25km, 30km, 35km, 40km and the Official Time(@ 42.195km). In total, 26630 people completed the marathon, of which 54% were men and 46% women.
We’ll be analyzing the following aspects of the race:
- Variation of athletes’ rankings over their timings
- Timing w.r.t. age
- The country-wise distribution of athletes
- Are athletes improving on the qualifying time limits, or slacking away?
- Pace discipline – Positive splits/Negative splits/Even splits?
- What do winners do! – Closer look at their splits
- Should you start slow or fast?
Overall Timing Analysis
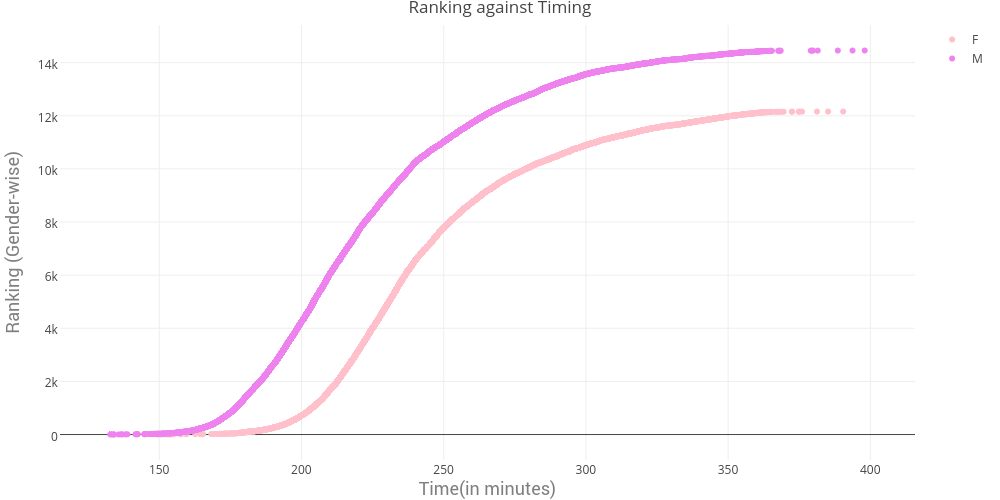
Both men and women exhibit a similar pattern – A few men finishing within the early 150-minute mark, then rising sharply. By 240-minutes(4 hours), more than half of the men had completed the 42.2K. An interesting point to note is the delta b/w men and women remains almost constant throughout. I’ve excluded a few outliers from the plot(finishing well after 6 hours, probable injuries)
Now let’s have a closer look at the same plot, but for the winners. The “Top 100” in both Mens and Womens category.
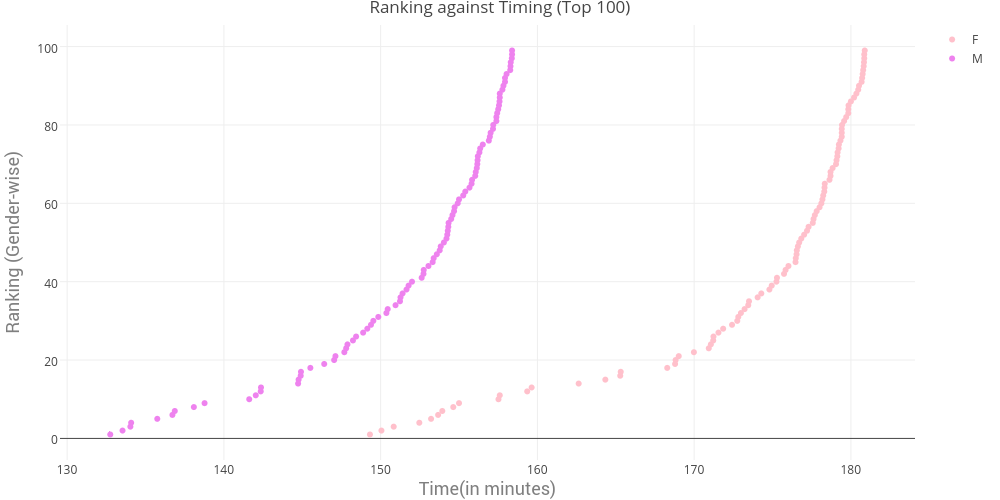
There is a clear time difference between the Top 10-20’s and the rest of the pack. Also, the difference between men and women diverges slightly as we go down the leaderboard.
Wonder there is something different about the Top 10 guys? Probably their countries of origin?
Country-wise distribution
Lets look at the demographics of the Top 100 men and Top 100 women.
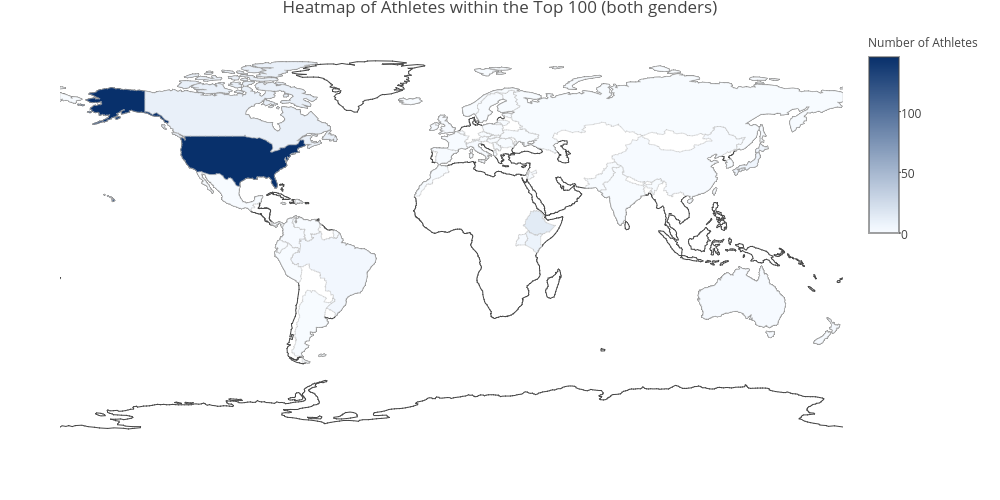
Lots of Americans. Expected. What about the Top 10?
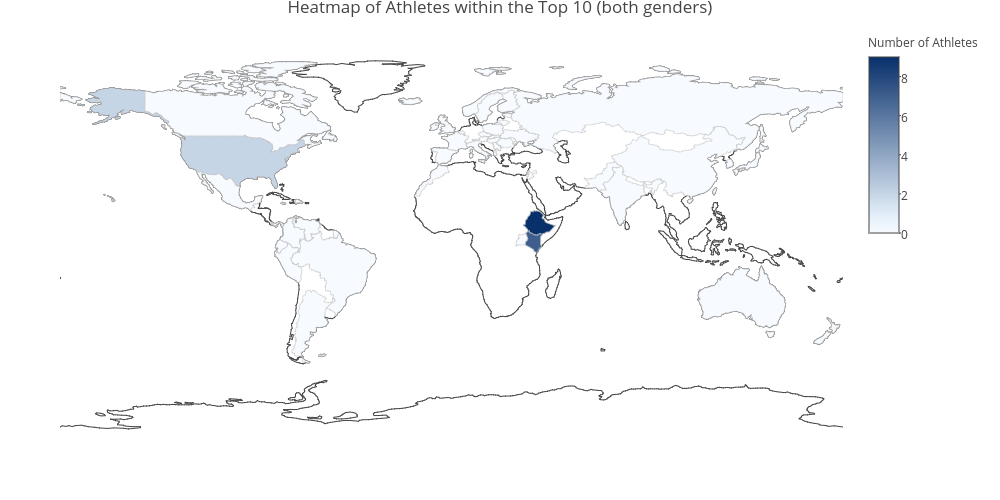
Kenyans and Ethiopians all the way – explains the runaway time difference.
Are the young guys faster?
This came as a total surprise to me!
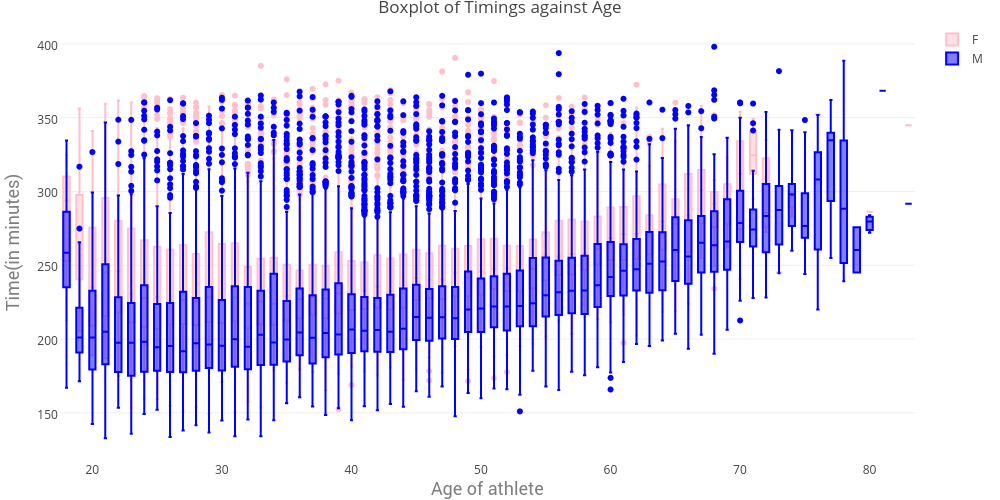
The timing dips to its minimum at around 25-30 years range. Clearly, experience and maturity have its advantages – Visualizations hurting my ego #DataEmo
Real Timing against the Qualifying Times
Boston has an incredibly tough cutoff for qualifying – 03:05:00 for men in the 18-34 age range!
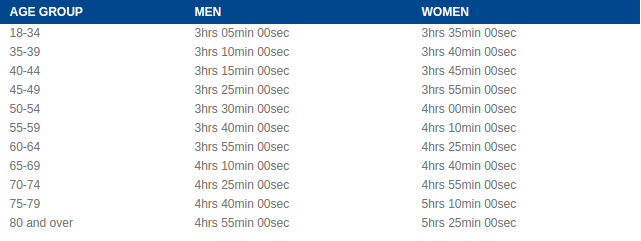
Here I’m trying to find what percentage of people are performing better than the qualifying limit, and how many slacked away. Probable reasons of a lower timing could be a tougher route(hills),or race day nerves – something i’m really curious to know about.
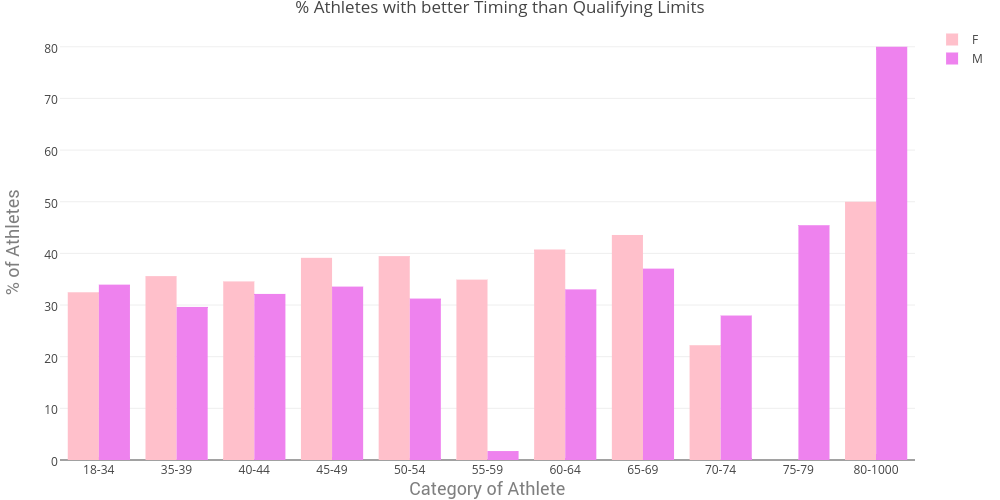
Clearly, not more than 40% people bettered the qualifying limit which is very surprising to me! Must have to do something with the route. An interesting point to note, women were consistently better than men across all age ranges.
Pace Discipline
Let’s get down to the serious stuff. Which splits should you make, should you go negative or stay even? How did the winners perform?
So, a positive split means the first half of your marathon was faster than your second half(which is usually the case), while a negative split means the inverse. A few athletes subscribe to going negative to push their timings – time to investigate!
We have data for every 5km split, except the 15-21.1K and 21.1K to 25K. To normalize, i’ve normalized the split timing with the athlete’s own mean speed – visualizing %difference from mean speed in each split. A positive %difference suggests the athlete was slower than his average.
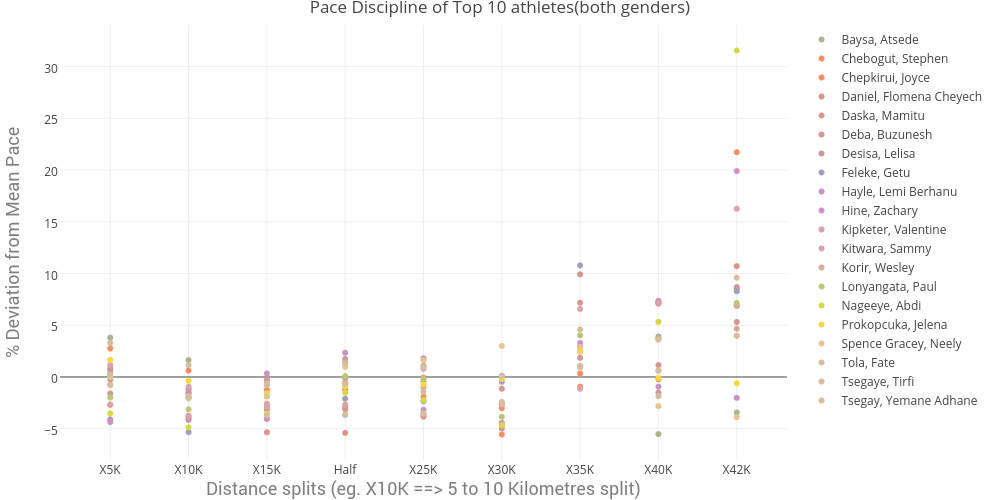
This is the visualization for the Top 10 men and the Top 10 women – clearly all of them slow down in the 30-35KM split, and it all goes erratic in the 40-42.2K split. This doesn’t give a very clear picture though, lets broaden the view a little.
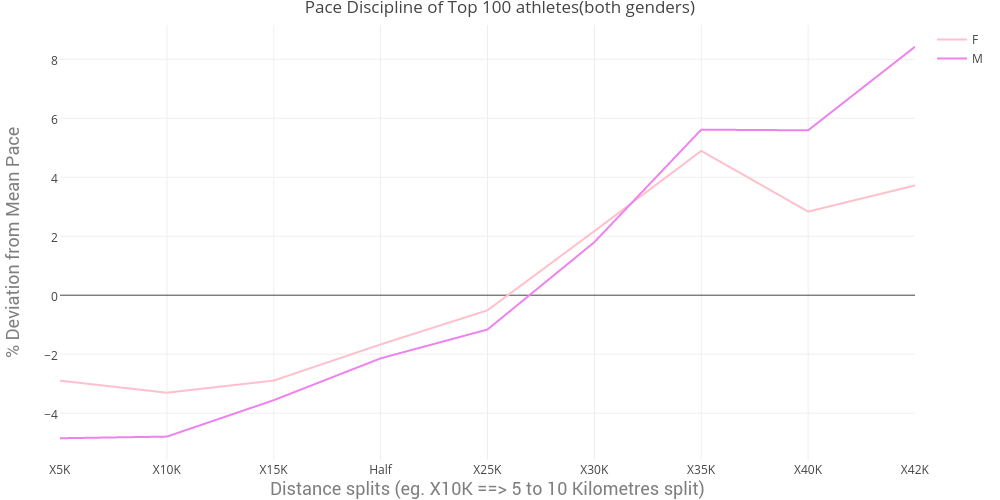
Here i’ve averaged the “%Deviation from Mean” for the Top 100 men and the Top 100 women. We still see the same pattern, running faster till 25K, and then 4% slower in the 30-35K split. Women, however stay closer to their mean throughout.
Okay, the 30-35K jump is pretty strange – particularly because it drops down closer to the mean in 35-40K. Apparently, there’s a famous “Heartbreak Hill” which starts at around the 32 Kilometre mark, a pretty notorious one in running circles!
Okay. This is pretty, but we still haven’t understood whether to negative split or not. A very good analysis on Kaggle suggests that very few athletes were able to negative split, Ethiopians and Kenyans were better at it than the rest.
This is a subjective debate, and i personally subscribe to the “even split” theory. It is relatively easier to maintain a pace, rather than push harder in the later stages of the marathon (thus slowing you further!). It is tough to see this theory in action here, primarily because of the hilly route in the second half. A much much better analysis on Negative splits by Fellrnr.
Slow Starts
Nevertheless, let’s investigate into the “Start Slow” theory – Your first couple of miles should be much slower than your average. To validate this, we’ll plot the athletes’ rankings against their %Deviation in the first 5K split.
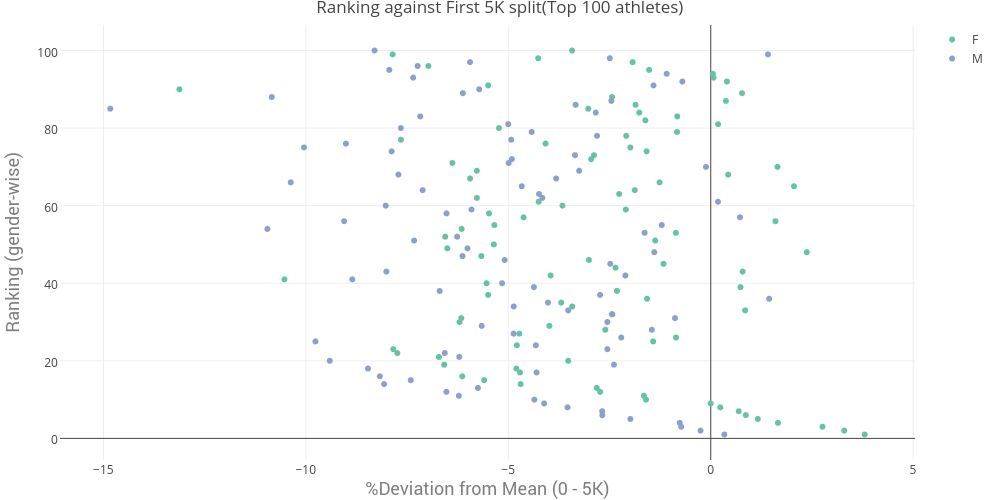
This plot looks haphazard, but i believe this has a few interesting insights:
- The winners (both mens and womens) have slightly positive or zero %Deviation from their average speed.
- Overall, most of the Top 100 athletes started out slower than their mean.
This leads me to conclude:
- If you’re looking for the top position, you should stay on your mean speed. No slow starts. (Validates the even split theory)
- If you’re looking for a good time, you should start slow, building up to your average speed later on.
What do winners do!
Doing the “Pace Discipline” analysis told us that the 30-35K split was tougher, pushing athletes to be 4% slower than their average. But, it still doesn’t tell us, how the winner paced his race.
We’ll plot the winner’s splits (in minutes) against the mean of the Top 10(excluding him/her). Should be indicative of where the winner raced ahead of the competitors.
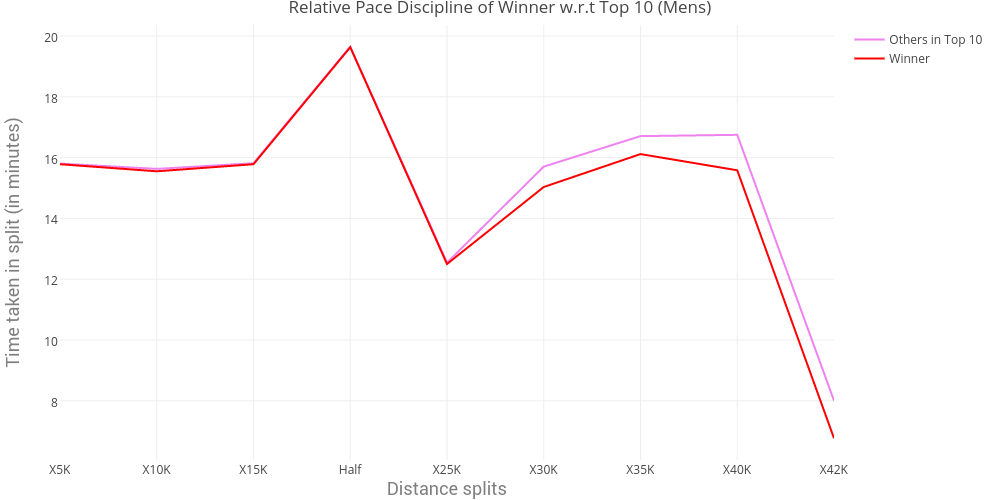
This was the Mens winner against the others in Top 10 – He stays with the pack till 25K, and then races slightly ahead in the 25-30K split. As the Heartbreak Hill approaches and everyone slows down, he makes it a point to not slow down as much increasing his lead ever so slightly. Over the next 7km, he maintains the lead beating second place by 47 seconds. Finished in 02:12:45.
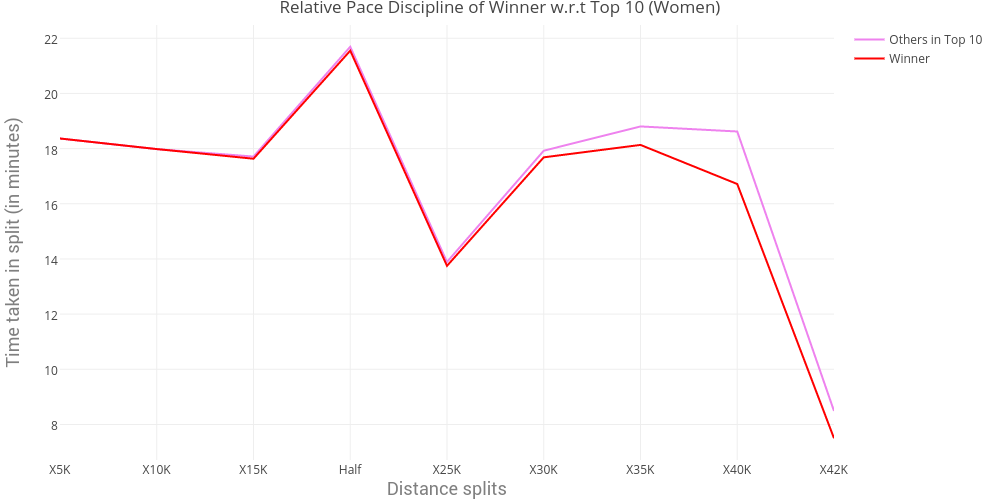
Funnily, the exact same pattern here too! Clearly, if you’re gonna win the Boston you gotta run the hill fast!
Conclusion
I’ve tried testing a subset of my hypotheses, and a lot more remain in the works. The “Negative Split” theory still troubles me, i can’t wrap my head around it.
Anyways, a few takeaways:
- If you wanna rank in the top 50, become a Kenyan or an Ethiopian
- Don’t be 20 years old. Grow older, you’ll run better
- The Boston route is tough, mostlikely you’re gonna perform worse than your qualifying race
- Be disciplined about your pace. Stay even.
- Stay with your pack of runners, everyone has it tough on the hills.
- Adrenaline is not good. Start slow.
- Analysis doesn’t matter. GO RUN!
So that’s that. Let me know if you liked this! Is there anything wrong with the analysis? Any biases in action? Feedback is important :)

Shubhankar is an awesome person. He's Co-Founder at Houseware, building the next generation of Analytics. In his spare time, he likes to go out on runs!