Did you know that you can navigate the posts by swiping left and right?
The science behind Election Polls | Trump Vs Clinton
12 Nov 2016
. category:
Math
.
Comments
#fivethirtyeight
#elections
#data science
On the 9th of November 2016, Donald J Trump became USA’s President-elect, surprising one and all! The journalistic community has gone beserk since, debating over how and why this has happened… But even more crazed are the pollsters who’ve been absolutely stumped by the results of the elections. Majority of the forecast polls had predicted a Clinton presidency, quite a few of them even placing their predictions as high as 98%.
Nate Silver, editor-in-chief of FiveThirtyEight, is one of the most reputed analysts in the business. If you agree with Silver’s models, the Republican had a 35% chance to get through. The highest any forecaster/pollster had given him!
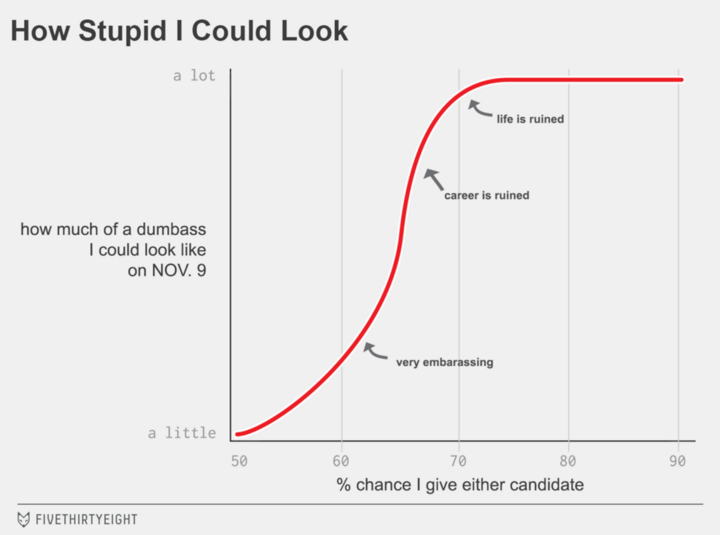
“As you can see in the graphic above, our model predicts that me fucking this election up would be “very embarrassing” at best, although a career or life-ruining public backlash also falls within the margin of error.” – Nate Silver.
If you favor a Twitter war between Silver and Grim on whether a GLM with a logistic link is the same as logistic regression, check this out!
So, even though every pollster was wrong, FiveThirtyEight was the least wrong. To understand why, we need to study how the polls are conducted and what magic do these data scientists weave! We’ll focus on Silver’s model, it’s methodology and the criticisms levelled against it. I’ve had a lot of fun studying all these techniques!
1. Collect Polls – The team at FiveThirtyEight collates all polls from pollsters (except the blacklisted organizations) as per their pollster list. This list contains pollster ratings based on previous predictions and their accuracy. The polls are given weightage depending on the sample size polled, the pollster organization, its reputation and recency of the poll. include pollster’s methodology
2. Adjust Polls – Now, the polls collected need to be adjusted for any biases or effects that might have crept in. Primarily, five adjustments are applied on the dataset.
-
Likely Voter Adjustment – The numbers are adjusted so as to convert the registered voter count to “likely voter” count.
-
Convention bounce adjustment – It has been empirically noted that after the Democratic or Republican convention, the respective candidate gains 3-4% points on average, owing to increased media coverage. This “bounce” is adjusted accordingly.
-
Omitted third-party candidate adjustment – The Liberal Party candidate, Gary Johnson has the ability to play kingmaker in many states! In polls that don’t consider the third party, votes are adjusted from the accounts of Trump and Clinton. The undecided voters are dealt with in the further stages of the model.
-
Trend line adjustment – The Trendlines are basically indicators of the flow of data. In our context, several pollsters have multiple versions of their polls, week after week. This periodical poll data is extremely useful in the sense that the sentiment with either candidate can be gauged perfectly, each version against the previous. This will eliminate any noise in the polls, as we’re just concerned with the delta – Compare apples with apples!
Technically, LOWESS(Local Regression) is used to map the trendlines. The data points are averaged in small sub-sections, so as to get a better picture of voter share over time. In the earlier stages of the campaign, the trend lines are smoothed conservatively(high smoothing constant), but the smoothing becomes more aggresive as the elections approach. This is done so as to account more for voter points closer to the elections rather than further to the elections.
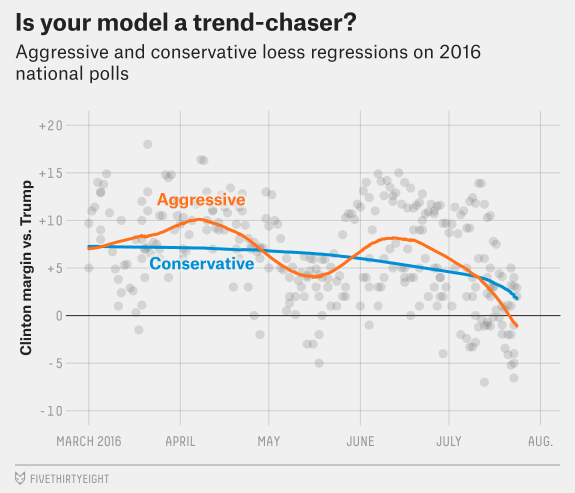
The smoothing constants are left to the discretion of the analysts, which is one of the major criticisms against Silver – fudge factors whose choice is not backed scientifically.
“We should just trust him ― which means his correctness is not falsifiable. When somebody creates a system that cannot be proven wrong or criticized, it becomes hard to believe it is right.” – Dale Rosenthal in his attack on Nate Silver
5.House effects adjustment – Certain pollster organizations are known to be either left-leaning or right-leaning depending on their history. It is a factor which has to be adjusted varyingly for different candidates differently in different states. This adjustment is done by generating an average poll(based on pollster ratings), and then comparing each poll against that average poll.
3. Combine polls with data – At this stage, economic factors as well as demographic differences are accounted for in the model. Also, the previously stated “Undecided Voters” are dealt here.
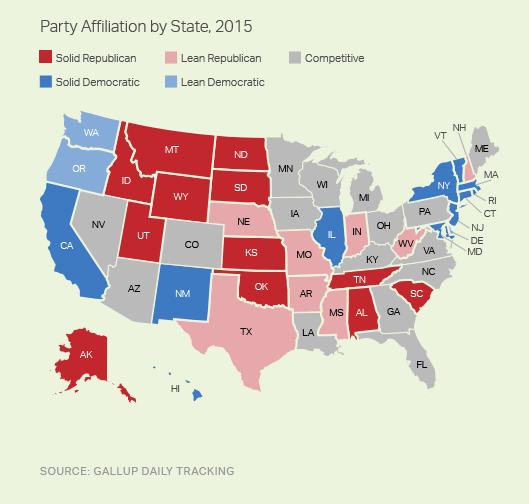
- Partisan Voter Index – The Partisan Voter Index (PVI), defines how democratic or republican a state has historically been. It is calculated by voter share for either party in previous presidential elections. PVI is an extremely useful indicator in regression models!
-
Demographic of a state – The United States are divided into four major demographic regions, which is also an important indicator for the model.(Northeast, South, Midwest, West)
-
Economic situation of a state – Various economic indicators of a state aggregated together generates the economic index. This is an important factor to analyze whether anti-incumbency is on the rise in that specific state, because of voter anger towards unemployment, or routine work. Forecasts based on purely the economic statuses of the states are called “Fundamental Forecasts”.
-
Elasticity of a state – Many states are historically Democratic or Republican, but certain “swing states” can sway the elections either way – this generally happens because the breakup of that state is pretty uniform in terms of race/education levels. The “elasticity” is thus, the effect a development in either presidential campaign, can have on the voter share – higher the swing, more the elasticity.
All these factors are included in their regression model, and blended with the previously modified poll average. The undecided voters are split evenly between the two candidates, but a small portion might be allocated to third/fourth party candidates in some states. According to Silver, this election is unique as there are an unusually high number of undecided voters till very late into the campaigns – this introduces a lot of uncertainity into the models! A 44-41 lead is a lot less safe than a 51-48 lead, even though they are both 3-point leads.
4. Simulation – The model is simulated tens of thousands of times, so as to minimize the sampling error. Each simulation accounts for three potential types of error and uncertainty:
- National error – The polls are systematically off throughout the country.
- Demographic error – The polls are off in states that have demographic factors in common.
- State-specific error – The polls are off in a particular state, with no effect on other states.
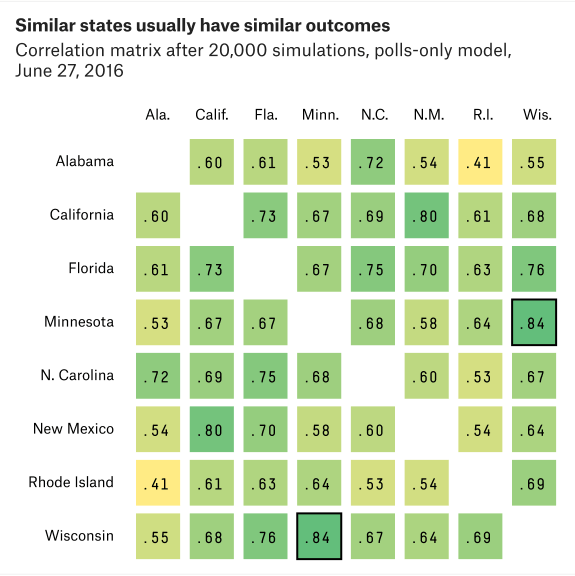
The Demographic/Regional error is the most important of the three – if Trump beats his polls in Minnesota, he’ll probably also do so in Wisconsin. This correlation can be explained by similar voter perceptions in states which are similar in terms of the populace breakup. In my opinion, this is one of the errors which the Democratic Camp had underestimated greatly – a systemic error that showed up in state polls as well as national polls.
Important Side-Note – These simulations are borrowing their error values from the student t-Distribution, which have fatter tails, thus giving high probabilities to unlikely events. This is one of the major reasons why Trump got such a high probability, which was perceived as the unlikely event. However, this is also a point of contention for other analysts, as they’ve questioned the type of t-distribution chosen and why! More research to be done on this point!
My Insights!
If you’ve read so far, I hope you get the technicalities of forecast polls and why they work(or don’t!). Analysts are still working on why most polls have failed, not just in this election but in the Israeli national election, the Scottish referendum and the UK general election, to name a few! Echo-Chambers is a term being thrown around quite a lot, the “left” doesn’t know about the “right”, and vice versa. Even the data scientists are accused of living in their bubble, and trying to affect the poll results as per their perception of the elections. Another theory going around is that Trump supporters were not comfortable revealing their choice to pollsters. It has also been seen that more people were okay with revealing “Trump” to automated voice polling than revealing “Trump” to live person polling! Some allege that Democrats got too complacent and their turnout was rather subdued, compared to the 2012 elections(A lot of Sanders’ voters didn’t turn up).
Heck even Trump’s data science team had placed their chances at 8% three weeks ago! The science is still out on what actually happened. Hope this helps!
Wanna go down a rabbit hole?
- FiveThirtyEight’s forecasts
- What a difference of 2 percentage points makes
- The polls missed Trump. Why!
- Why our model is more bullish than others on Trump
- Clinton’s lleading in exactly the states she needs to win
- When house effects become bias
- Criticism of Nate Silver’s model
- I’m a stats prof. Here’s why Nate Silver’s model was all over the place
- Trump will win – One of the few correct predictions
Image sources – FiveThirtyEight
And if you’re really worried where the United States is headed, chill! Tim Urban’s got you covered!

Shubhankar is an awesome person. He's Co-Founder at Houseware, building the next generation of Analytics. In his spare time, he likes to go out on runs!